All This and Data Too?
With a long list of goals, short attention spans, and a wide range of behaviors to deal with, do you ever feel like you just don’t have time for keeping track of data in your sessions? If so, try some of these ideas. They aren’t rocket science. They are actually quite simple- and that’s what makes them work.
Let’s face it- data is important. We need it to know how our clients are doing and when their goals have been achieved. It’s also important for our clients to know how they are doing and when they will have reached the “finish line” for that goal. We need it to chart progress for ourselves, for our clients, and for their caregivers.
The key for easy data collection is to work in groups of ten. Whether it’s a list of “r” words, pictures of verbs, or a set of vocabulary words, work in groups of ten. This makes it so much easier to calculate percentages. (For those situations when ten trials is not enough, you can work in groups of twenty and multiply the number correct by 5, or do twenty-five trials and multiply by 4.)
1. If you are working with pictures or cards, use those to keep track for you. Simply place the correct cards in one stack and the incorrect ones in another. When you are done, count the correct ones, add a zero, and that is your percentage (e.g., seven cards in the correct stack = 70%).
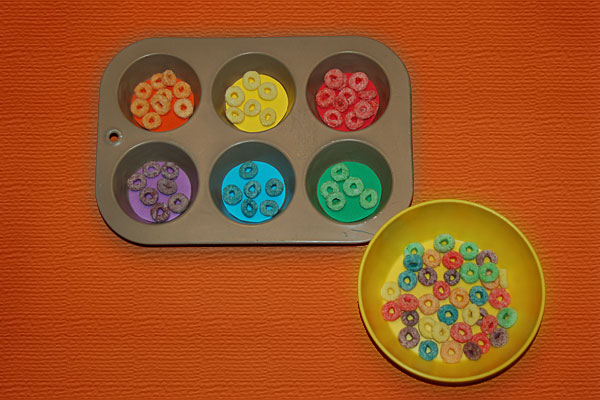
2. Give the child a sticker or token or some other object (e.g., piece for a Cootie Bug) for each correct answer. Again, the number of objects they have at the end corresponds to the percentage correct.
3. Have the child move ahead one space on a game board for each correct response. Count how many spaces he/she has moved after ten attempts.
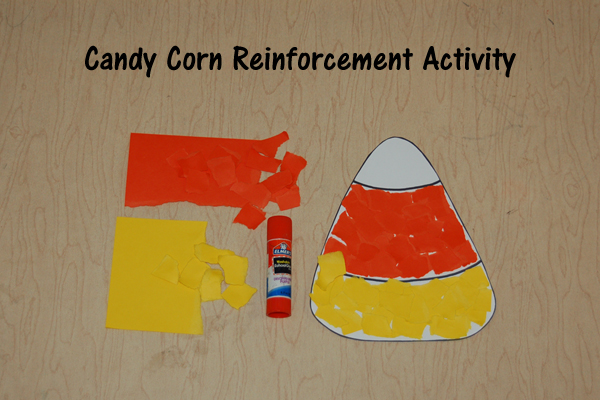
4. Have the child color or glue a picture on a reinforcement activity page. If you want the child to be able to color after each attempt, give him/her a certain color to use when the response is correct.
5. Keep tally marks on a scrap of paper. Ok, really basic, but in some situations, this is just the best way to keep track. You can use any markings you want.
Use this simple graph for keeping track of data. I draw a dark line across at the target percentage (e.g., 80%) to make it clear where the “finish line” is. For children that are old enough to color in the lines, I outline the area that represents their percentage for that session and let them color it in.
Get new posts by email- Go to the Free page and enter your email address. You’ll never miss an idea!

Leave a Reply
You must be logged in to post a comment.
This blog is great. It is a useful combination of old school and new. I recommend this blog to any therapist trying to help kids of all ages. Thanks for your hard work.
Lynn Bo
http://www.AccentMaster.com
Lynn@AccentMaster.com